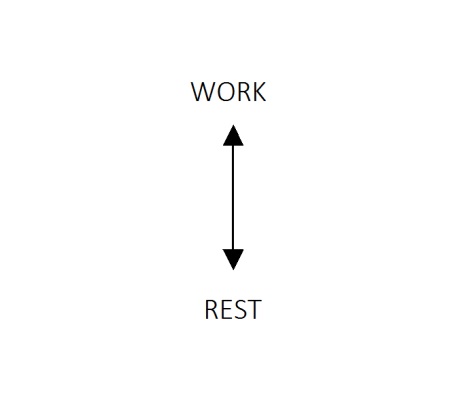
From our cyclic observations of business activity, we can then see that there is a time to work and a time to rest.
For the moment, we’ll think of this as a kind of up and down switching movement, though we’ll see as we develop this model that things are not all that they are assumed to be:
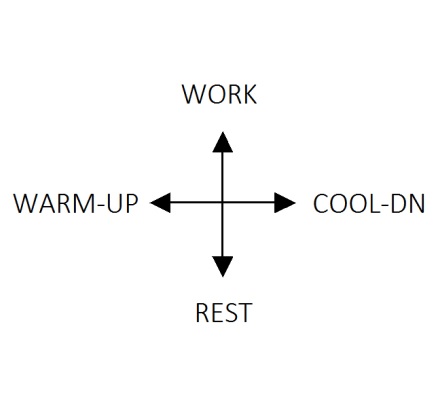
We know that there are intermediate states between work and rest, which we are taught are good practice to observe:
We also know that, even when taking into consideration the stepping stones of warming-up and cooling-down, that this “whole” movement is not an all-of-a-sudden switching from one state to another, but a seamless transitioning or fluxing from one state to another, akin to the movement of the seasons:
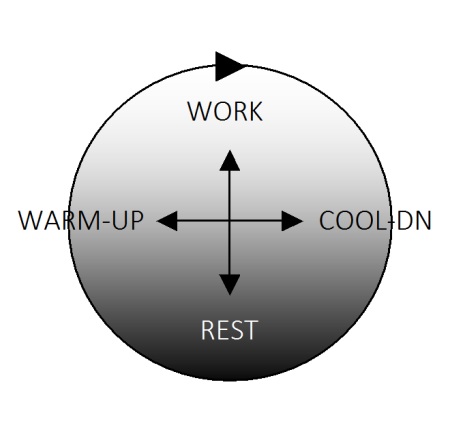
We can now then start to see the “life cycle” as the circle completes and repeats. But we know that as the circle is completing and repeating that time is always moving on, or time is always being created, whichever way we choose to look at it. So what we are looking at is not really a circling motion, but a spiralling motion, where each new “time” that is created can be said to have a space-time coordinate that is uniquely its own. Keeping in mind that this is a spiralling motion (ie a 3D spiral not a 2D circle), for illustration purposes we can start to show this motion in 2D as a sinusoidal waveform. In 3D, an easy way to picture this is to think of a slinky or a spring, which you then extend out and look at side on:
We know however from Hurst’s research that our artificer activity (which also reflects our “deeper” natural activity) is not simply a single waveform, but a whole series of waveforms existing all at once:
We also know that we can add these waveforms together to create a “whole” or single form. In quantum theory, such summation or coalescing is known as superpositioning. There are also many other names this principle goes by, depending on which fields of natural and artificer activity you are interested in. And so we arrive back at the kind of fractal waveform which deep market observers noticed in business activity and the financial markets:
Now, we have discussed the model charts and waveforms in this section from a viewpoint of economic systems, but we can also use this model to help develop a model for ecosystems as a whole (which includes human activity) and the determination of space-time coordinates. And as these space-time coordinates link together over time, we can refer to the resulting patterning as a space-time continuum.
TIME >>>